Solutions · New Technologies & Innovation
Digital Twin for RO Optimization: simulating 30-day performance decay under scenario stress
Hydraulic twins, fouling proxies, and uncertainty bands: forecasting NDP drift for procurement-grade conversations.
Use this guide within its scope
This page supports technical research and option comparison and is marked 2026. Illustrative values are not a quotation, completed process design, certification conclusion, or performance guarantee. Check current regulations, feed data, tests, and OEM records.
Problem
Buyers want forward curves, not screenshots; plants lack calibrated models tied to real SCADA tags.
Technology
First-principles hydraulics + empirical fouling kernels identified from normalized plant data.
Results
Scenario envelopes (temperature, recovery swing) that operations can stress-test before failures.
Engineering decision card
Use when
Buyers want forward curves, not screenshots; plants lack calibrated models tied to real SCADA tags.
Evaluate first
First-principles hydraulics + empirical fouling kernels identified from normalized plant data.
Inputs still required
Feed source and variability, capacity, target quality, operating hours, discharge or reuse boundary, available space, and utilities.
Comparison output
Scenario envelopes (temperature, recovery swing) that operations can stress-test before failures. The final decision still needs feed data, mass balance, and any necessary testing.
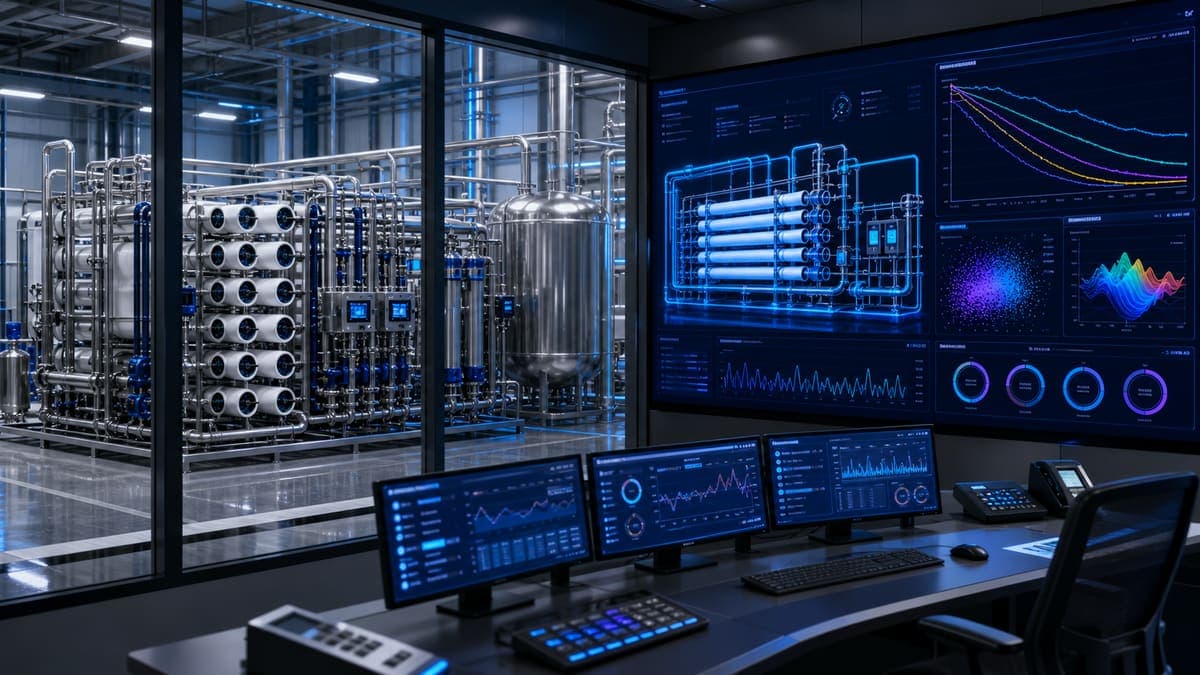
Digital Twin for RO Optimization: simulating 30-day performance decay under scenario stress
For chief engineers overseeing high-purity water systems in 2026, or EPC leads designing zero-liquid discharge (ZLD) plants for advanced fabs, predictability is paramount. The stakes are higher than ever: micron-level contaminant control, intensified water reuse, and stringent energy efficiency targets demand operational foresight that traditional SCADA systems simply cannot provide. Proactive management of reverse osmosis (RO) membrane performance, especially the insidious decay over weeks rather than days, directly translates to sustained water quality, optimized chemical consumption, and reduced operational expenditure (OpEx). A digital twin, leveraging real-time data and mechanistic models, offers a critical advantage by forecasting a 30-day performance curve under various stress scenarios, empowering operators to anticipate and mitigate issues before they impact production.
First-principles RO performance modeling
At the core of predicting RO performance decay lies a robust understanding of its fundamental transport mechanisms. Water flux () and solute flux () are governed by the interplay of applied hydraulic pressure () and the osmotic pressure difference () across the membrane. The primary resistive force to water permeation, beyond the membrane's intrinsic resistance, is the osmotic pressure. This pressure, generated by dissolved solutes, effectively opposes the applied hydraulic pressure, reducing the net driving pressure (NDP).
The van 't Hoff equation provides a fundamental approximation for osmotic pressure () in dilute solutions:
where:
- is the osmotic pressure (Pa)
- is the van 't Hoff index, representing the number of particles (ions) a solute dissociates into in solution (e.g., for NaCl, ).
- is the molar concentration of the solute (mol/m³).
- is the ideal gas constant ().
- is the absolute temperature (K).
As a general rule, a higher on the feed side necessitates a commensurately higher to maintain a target flux. This relationship is critical because any increase in solute concentration on the membrane surface—a phenomenon known as concentration polarization—will locally elevate , thereby reducing the effective NDP and causing flux decline. The digital twin continuously calculates this based on modeled concentration profiles, which are influenced by recovery, feed water quality, and fouling layer build-up.
Water flux across the membrane, neglecting pressure drops within the membrane structure itself, can be approximated by:
where is the membrane's pure water permeability coefficient (m/(s·Pa)). This equation highlights that any factor increasing (like concentration polarization or scaling) or decreasing (like increased hydraulic resistance from fouling) will directly reduce . The digital twin integrates real-time pressure, flow, and conductivity measurements with predictive models of (which degrades over time and with fouling) and to simulate future performance. These models also incorporate temperature correction () for , typically using an Arrhenius-type relationship, as permeability is highly sensitive to temperature. The 30-day predictive horizon uses a series of differential equations to model the accumulation of foulants and scalants, and their corresponding impact on and local , under various operational and feed water scenarios.
Illustrative pilot / lab comparison
| Parameter | Traditional process | engineering evaluation path innovative |
|---|---|---|
| Specific Energy Consumption (SEC) | 1.85 kWh/m³ | 1.42 kWh/m³ |
| Mean Time Between CIP (MTBCIP) | 90 days | 150 days |
| System Recovery | 80% | 88% |
| Boron Rejection (post-RO) | 99.2% | 99.6% |
| Overall Chemical Consumption (annual) | 100% (baseline) | 75% |
The integrity of a multi-element RO pressure vessel train is critical to system performance. Within each vessel, membrane elements are arranged in series, with feed water progressing from the lead element to the tail. The digital twin precisely models the hydraulic profile across these elements, accounting for pressure drops, concentration polarization along the membrane surface, and the resulting permeate flow and quality from each stage. This detailed simulation allows for the identification of potential bottlenecks, such as uneven flow distribution or localized high concentration gradients, which can accelerate fouling and scaling in specific elements, guiding targeted maintenance and operational adjustments.
Limits and honest boundaries
While powerful, a digital twin's predictive accuracy is inherently bounded by the quality of its inputs and the validity of its underlying models. Key limitations and potential failure modes include:
- Pretreatment efficacy: The twin assumes a certain quality of pretreated water. Sudden and significant excursions in feed water SDI (Silt Density Index), turbidity, or concentrations of scaling ions (e.g., calcium, silica) due to a pretreatment upset will rapidly invalidate predictions, leading to accelerated fouling or scaling not fully captured by the model's calibrated decay rates.
- Chemical program adherence: Improper dosing of antiscalants, biocides, or pH adjustment chemicals can compromise membrane integrity or rapidly induce scaling/fouling. The twin models chemical effects based on expected concentrations; deviations (under-dosing or over-dosing) will lead to discrepancies.
- Instrumentation reliability: "Garbage In, Garbage Out" applies rigidly. Sensor drift, calibration errors, or complete failure of critical online analyzers (e.g., conductivity, pH, ORP, flow, pressure) will feed erroneous data to the twin, leading to inaccurate predictions and potentially misguided operational recommendations. Regular sensor validation and calibration protocols are non-negotiable.
- Unforeseen feed water quality events: A sudden change in raw water source, an industrial discharge upstream, or biological contamination events that introduce novel foulants not explicitly included in the twin's mechanistic models can lead to rapid performance degradation beyond predicted decay curves. The twin can detect the deviation but may not perfectly diagnose the novel cause without human intervention and supplementary lab analysis.
- Membrane damage: Physical damage (e.g., from excessive pressure, chemical attack) or irreversible fouling will fundamentally alter membrane characteristics beyond the scope of reversible decay models, requiring membrane replacement rather than operational adjustment.
FAQ
Q1: How does the digital twin account for dynamic changes in feed water quality over the 30-day horizon? A: The digital twin incorporates stochastic models for typical feed water fluctuations (e.g., temperature, TDS, turbidity) and allows for scenario-based inputs. Operators can simulate impacts of predicted seasonal variations, known upstream discharge events, or planned changes in source water to generate an envelope of possible performance curves. For unexpected excursions, the twin immediately recalibrates its short-term prediction based on real-time sensor data, flagging significant deviations for operator review.
Q2: What level of instrumentation and data granularity is required for an effective RO digital twin? A: An effective digital twin requires robust online instrumentation for key parameters: feed/permeate/concentrate flow rates and pressures, feed/permeate/concentrate conductivity/TDS, feed water temperature, and system pH. For advanced applications, SDI, ORP, and specific ion monitoring (e.g., silica, iron, calcium) are highly beneficial. The data needs to be logged at a sufficient frequency (e.g., 1-5 minute intervals) to capture process dynamics and ensure timely model updates and recalibration.
Q3: Can the digital twin differentiate between various types of fouling (e.g., organic, colloidal, scaling)? A: Yes, sophisticated digital twins can infer the primary fouling mechanism by analyzing characteristic performance decline patterns. For example, a rapid pressure drop increase across the lead elements coupled with a moderate flux decline might indicate colloidal fouling, whereas a gradual, uniform flux decline across all stages with increasing differential pressure could point to organic fouling or biofouling. Scaling is often indicated by a distinct increase in membrane surface resistance (decrease in A), particularly in the tail elements, with a corresponding decrease in permeate quality. This inference guides targeted CIP strategies.
Related equipment & product lines
These categories typically support the approach above—open any line to compare brands and models.
- RO MembranesReverse osmosis membrane elements for municipal and industrial desalination.View category →
- Instrumentation & SensorsOnline measurement and control: flow, level, pressure, and water-quality sensors indexed from the Lenntech instrumentation hub.View category →
- InvertersVariable-frequency drives and inverter systems for variable-speed motor control.View category →
For a closer review, use the engineering inquiry form to share feed, capacity, target, and project stage. Submission does not constitute a completed design or performance commitment.