Solutions · Sustainability & ESG
Carbon Footprint Tracking for Water Plants: meter-grade data for ESG disclosures
Boundary definitions, grid factors, and MWh attribution—so CDP-style answers survive auditor questions.
Use this guide within its scope
This page supports technical research and option comparison and is marked 2026. Illustrative values are not a quotation, completed process design, certification conclusion, or performance guarantee. Check current regulations, feed data, tests, and OEM records.
Problem
Spreadsheet carbon stories collapse when someone asks which meter proved the number.
Technology
Time-stamped SCADA integration and export templates for disclosure frameworks.
Results
Repeatable year-on-year intensity metrics (e.g. kgCO2e/m³).
Engineering decision card
Use when
Spreadsheet carbon stories collapse when someone asks which meter proved the number.
Evaluate first
Time-stamped SCADA integration and export templates for disclosure frameworks.
Inputs still required
Feed source and variability, capacity, target quality, operating hours, discharge or reuse boundary, available space, and utilities.
Comparison output
Repeatable year-on-year intensity metrics (e.g. kgCO2e/m³). The final decision still needs feed data, mass balance, and any necessary testing.
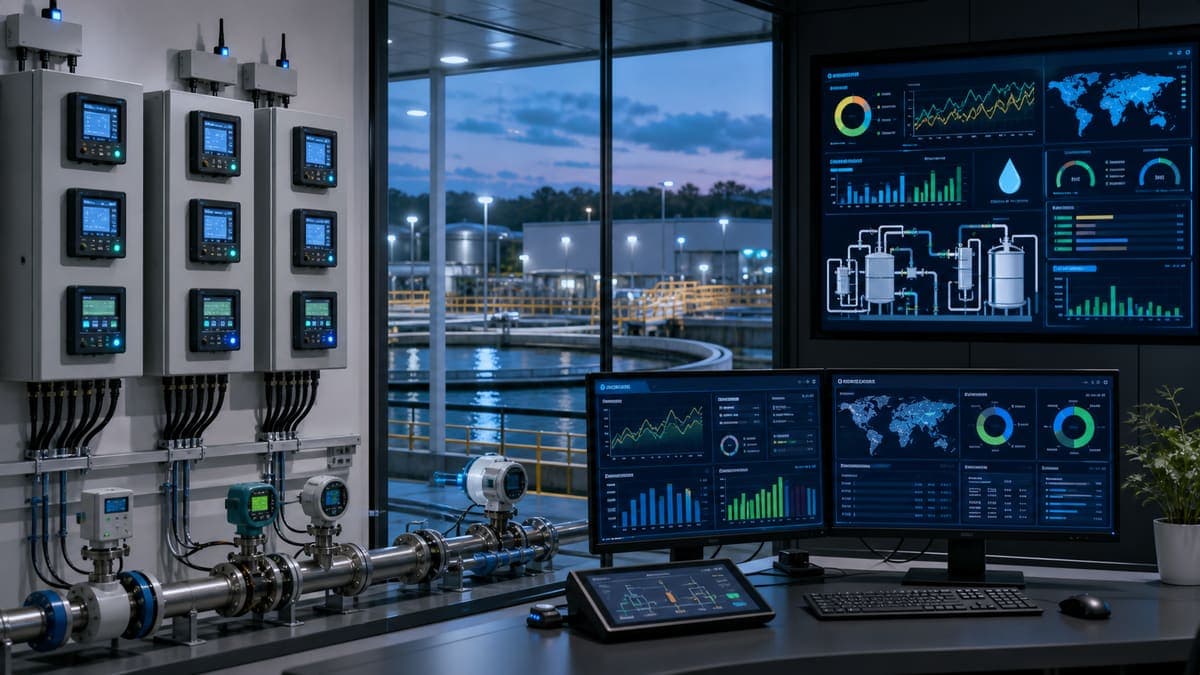
Carbon Footprint Tracking for Water Plants: Meter-Grade Data for ESG Disclosures
The global industrial landscape, particularly within the UK and EU, is undergoing a profound transformation driven by intensified ESG mandates. For industrial buyers, Engineering, Procurement, and Construction (EPC) firms, and sustainability officers, navigating this new reality means scrutinising every link in their supply chain for environmental impact. Central to this is the carbon footprint of water management – a historically under-reported, yet critically energy-intensive, component of industrial operations.
The Imperative of Granular Data
Water treatment, whether for intake, process, or effluent, is a significant energy consumer. Pumps, aeration systems, membrane filtration, UV disinfection, and chemical dosing all contribute substantially to an industrial facility's overall energy demand, and consequently, its carbon footprint. The challenge lies not just in identifying these energy sinks, but in quantifying their specific consumption with the accuracy needed for stringent ESG reporting and impactful operational optimisation.
Traditional approaches often rely on facility-wide energy bills, which obscure the specific energy intensity of water operations. To genuinely track and reduce emissions, organisations need to understand the kilowatt-hours (kWh) consumed per cubic meter (m³) of water processed, treated, or discharged. This specificity unlocks opportunities for targeted interventions, from optimising pump schedules and selecting more efficient equipment to fine-tuning chemical dosing and aeration processes. Furthermore, it allows for a clear, auditable trail of emissions reductions, essential for both internal sustainability targets and external stakeholder reporting.
Worked energy / carbon sketch
Let's illustrate the potential impact of data-driven optimisation on the carbon footprint of an industrial water treatment plant (IWTP).
Consider an industrial facility operating an internal water treatment system that supplies process water and treats its wastewater.
Assumptions (Illustrative):
- Plant Flow Rate (Q): 750 cubic meters per hour (m³/h)
- Annual Operating Hours (H): 7,884 hours per year (approx. 90% uptime)
- Baseline Specific Energy Consumption (Pre-optimisation): 0.75 kWh/m³ (typical for processes including pumping, filtration, and basic treatment)
- Optimised Specific Energy Consumption (Post-optimisation): 0.55 kWh/m³ (achieved through pump efficiency upgrades, advanced control, and process optimisation, representing a Δ0.20 kWh/m³ saving)
- Grid Emission Factor (Illustrative UK/EU average for 2026): 0.18 kg CO₂e/kWh (reflecting ongoing grid decarbonisation efforts)
Calculation:
-
Annual Water Treated: Annual Water = Q × H = 750 m³/h × 7,884 h/year = 5,913,000 m³/year
-
Annual Energy Savings: ΔkWh/m³ = 0.75 kWh/m³ - 0.55 kWh/m³ = 0.20 kWh/m³ Annual Energy Savings = Annual Water × ΔkWh/m³ Annual Energy Savings = 5,913,000 m³/year × 0.20 kWh/m³ = 1,182,600 kWh/year
-
Annual Carbon Emissions Reduction: Annual Carbon Reduction = Annual Energy Savings × Grid Emission Factor Annual Carbon Reduction = 1,182,600 kWh/year × 0.18 kg CO₂e/kWh Annual Carbon Reduction = 212,868 kg CO₂e/year
Converted to tonnes: 212,868 kg CO₂e / 1000 = 212.87 tonnes CO₂e/year
This back-of-envelope sketch demonstrates that even a seemingly modest improvement in specific energy consumption (Δ0.20 kWh/m³) can lead to significant annual carbon footprint reductions, quantifiable in hundreds of tonnes of CO₂e for a medium-to-large industrial water user. These are the kinds of verifiable numbers demanded by today's ESG reporting frameworks.
Traditional vs engineering evaluation path
| Topic | Spreadsheet carbon | Meter-grade water plant data (engineering evaluation path) |
|---|---|---|
| Boundary | One bill; water energy lost in “other”. | Sub-meters on pumps, blowers, RO, recovery trains. |
| Audit | Allocations that break under questions. | Timestamped kWh/m³ and mass balance exports. |
| Action | Retrofits picked by gut feel. | Ranked intensity + alerts before failures spike kWh. |
Supporting Water Stewardship and ESG Disclosures
The rigorous data collection facilitated by systems like this approach directly underpins robust water stewardship and comprehensive ESG disclosures. Organizations face increasingly detailed questionnaires from initiatives like CDP Water Security and the Alliance for Water Stewardship (AWS) Standard. These frameworks require not just declarations of intent but quantifiable metrics on water consumption, effluent quality, chemical usage, and associated energy and emissions.
By implementing meter-grade tracking for your water systems, you can provide precise answers to critical questions:
- What is the absolute volume of water withdrawn, consumed, and discharged?
- What is the specific energy intensity (kWh/m³) of your raw water intake, process water treatment, and wastewater treatment?
- How much CO₂e is directly attributable to your water management activities?
- What is the efficiency of your water recycling and reuse systems?
- How does chemical dosing directly correlate with water quality parameters and operational energy?
This level of detail moves beyond mere compliance, enabling strategic decision-making. It empowers facilities to identify hotspots, prioritise investments in efficiency, and demonstrate tangible progress to investors, customers, and regulators. Critically, it builds trust and credibility, enabling organisations to credibly communicate their environmental performance and contribute to their overall resilience.
For a quick estimate of your own potential carbon savings, use the interactive Carbon Savings Calculator located below this article.
FAQ
Q1: What specific data points are crucial for accurate carbon footprinting in water plants? A1: Key data points include volumetric flow rates at various stages (intake, process, discharge), specific energy consumption (kWh) for pumps, aeration, and other powered equipment per cubic meter of water, chemical consumption (kg) per cubic meter, and operational hours of each process unit. This granular data allows for a true mass and energy balance.
Q3: Is carbon footprint tracking for water plants relevant for smaller industrial users or only large facilities? A3: It is relevant for all industrial water users, regardless of size. While larger facilities might have a greater absolute footprint, smaller and medium-sized enterprises (SMEs) are increasingly facing demands from their larger supply chain partners (especially in the UK and EU) to report their emissions. Granular data is essential for meeting these demands and maintaining market access.
Carbon savings calculator (illustrative)
Estimate annual electricity savings and avoided CO₂e when specific energy improves (e.g. after ERD, VFD tuning, or train optimization). Replace defaults with your meter data and your grid emission factor from your utility or ESG methodology.
ΔkWh/year ≈ Q(m³/h) × hours/year × (kWh/m³before − kWh/m³after) · tCO₂e ≈ ΔkWh × factor / 1000
Δ specific energy: 1.00 kWh/m³
Estimated electricity savings: 800,000 kWh/year
Indicative avoided emissions: 336 tCO₂e/year
Related equipment & product lines
These categories typically support the approach above—open any line to compare brands and models.
- Instrumentation & SensorsOnline measurement and control: flow, level, pressure, and water-quality sensors indexed from the Lenntech instrumentation hub.View category →
- InvertersVariable-frequency drives and inverter systems for variable-speed motor control.View category →
- Pumps & PumpingHigh-pressure and process pump solutions for water treatment skids and plants.View category →
For a closer review, use the engineering inquiry form to share feed, capacity, target, and project stage. Submission does not constitute a completed design or performance commitment.