Solutions · Sustainability & ESG
Chemical-Free Disinfection (UV/Ozone): reducing chlorinated by-product risk
Targeted UV dose and controlled ozone contact—when they replace or reduce chlorine, and how to document residual strategy for regulators.
Use this guide within its scope
This page supports technical research and option comparison and is marked 2026. Illustrative values are not a quotation, completed process design, certification conclusion, or performance guarantee. Check current regulations, feed data, tests, and OEM records.
Problem
Chlorination by-products and chemical handling burden push buyers toward non-chlorine barriers.
Technology
Validated dose, redox/ORP monitoring, and safety interlocks.
Results
Lower chemical storage and truck traffic; clearer ESG chemical-intensity metrics.
Engineering decision card
Use when
Chlorination by-products and chemical handling burden push buyers toward non-chlorine barriers.
Evaluate first
Validated dose, redox/ORP monitoring, and safety interlocks.
Inputs still required
Feed source and variability, capacity, target quality, operating hours, discharge or reuse boundary, available space, and utilities.
Comparison output
Lower chemical storage and truck traffic; clearer ESG chemical-intensity metrics. The final decision still needs feed data, mass balance, and any necessary testing.
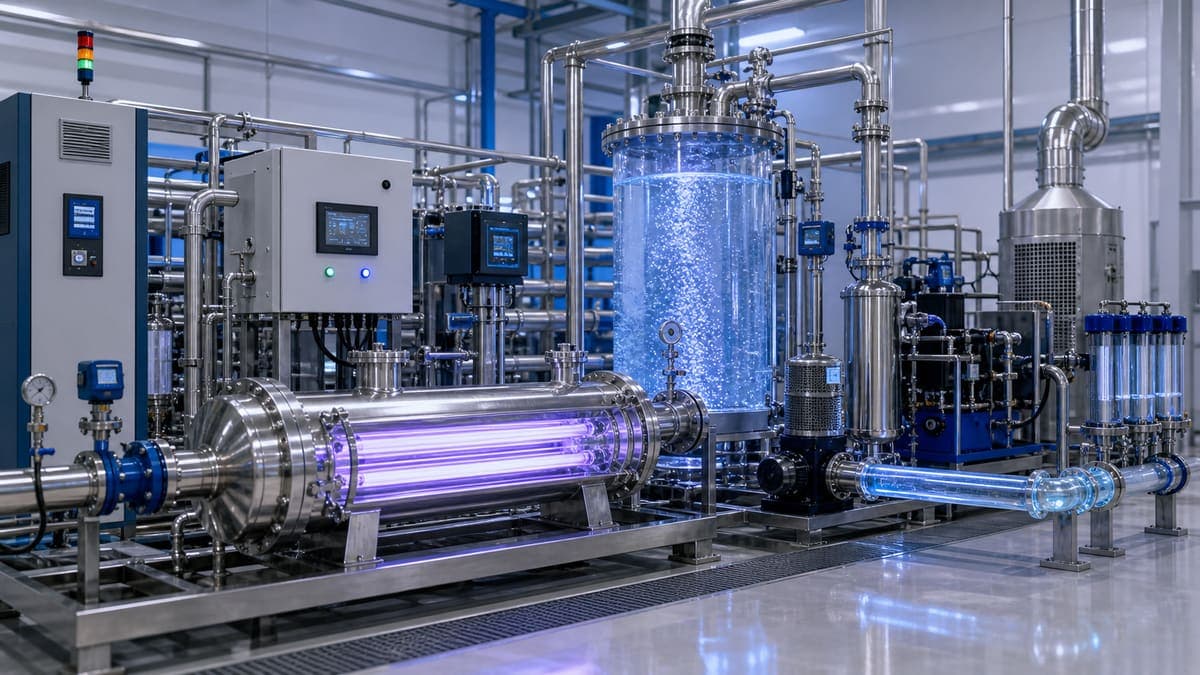
Chemical-Free Disinfection (UV/Ozone): reducing chlorinated by-product risk
In an era defined by intensifying climate action and mounting water scarcity, industrial operations face unprecedented pressure to demonstrate environmental stewardship. The global drive towards decarbonisation and circularity intersects critically with water management, especially in regions like the EU and UK, where discerning buyers and regulatory bodies impose stringent ESG (Environmental, Social, and Governance) requirements across supply chains. Water is not just a resource; it's a strategic asset and a significant vector for both risk and opportunity.
Traditional chemical disinfection methods, while effective, often introduce complex challenges: the carbon footprint associated with chemical production and transport, safety risks in handling, and critically, the formation of disinfection by-products (DBPs), particularly chlorinated by-products. These DBPs are increasingly scrutinised for their potential environmental and health impacts, leading to stricter discharge limits and heightened regulatory oversight. For companies exporting to or operating within the EU/UK, managing these by-products is no longer optional; it's an ESG gatekeeper.
The Problem with Chlorinated By-Products
Chlorine and its compounds are widely used for their potent disinfecting properties. However, when chlorine reacts with natural organic matter (NOM) present in water, it forms a range of DBPs, including trihalomethanes (THMs) and haloacetic acids (HAAs). These compounds are persistent, can be toxic to aquatic life, and some are suspected human carcinogens. Regulatory bodies worldwide, particularly within the EU, are consistently lowering permissible limits for these substances in both potable water and industrial effluents. This necessitates costly and energy-intensive post-treatment processes to remove DBPs, or a proactive shift to alternative disinfection methods.
UV and Ozone technologies offer a robust alternative. UV irradiation inactivates microorganisms by damaging their DNA, preventing replication, while Ozone is a powerful oxidant that breaks down contaminants and inactivates pathogens without leaving harmful residuals, rapidly decomposing into oxygen. Both methods provide effective disinfection while virtually eliminating the formation of chlorinated by-products, thereby simplifying downstream treatment and ensuring compliance.
Worked energy / carbon sketch
Consider an industrial facility processing 1,000 m³/day (approx. 42 m³/hour) of process water, currently relying on significant chlorine dosing followed by an energy-intensive activated carbon filtration system and periodic membrane cleaning to manage disinfection by-products (DBPs) and maintain water quality for discharge.
Illustrative Scenario:
- Current State (Chlorination + DBP Management):
- Chlorine dosing pump energy: 0.005 kWh/m³
- Activated carbon filtration (pumping, regeneration, backwash): 0.05 kWh/m³
- Energy for post-treatment chemical dosing (e.g., dechlorination, pH adjustment): 0.01 kWh/m³
- Total operational energy (Chlorine-related): 0.065 kWh/m³
- Proposed State (this approach UV/Ozone System):
- UV/Ozone disinfection system energy: 0.15 kWh/m³ (Higher direct energy use for disinfection)
- Elimination of activated carbon filtration and post-treatment chemical dosing for DBP management due to chemical-free disinfection.
- Total operational energy (UV/Ozone): 0.15 kWh/m³
In this specific scenario, a direct comparison of on-site operational energy for disinfection and DBP management shows a potential increase in electricity consumption by 0.085 kWh/m³. However, this narrow view misses critical elements of the broader carbon footprint and compliance benefits.
The true sustainability benefit arises from:
- Elimination of upstream chemical production and transport: Chlorine production is energy-intensive, and its transport has a significant carbon footprint. By not using 15 kg of chlorine per day (illustrative), we avoid ~15 kg CO₂e/day from chemical manufacturing and logistics alone (actual figures vary widely by production method and distance).
- Reduction in wastewater treatment load: Fewer DBPs mean less complex, and thus less energy-intensive, wastewater treatment processes downstream.
- Enhanced compliance: Avoiding fines and the energy/resource costs of remediation associated with DBP excursions.
While the specific kWh/m³ for direct disinfection might increase, the overall system carbon footprint is reduced by eliminating the embodied energy of chemicals and simplifying downstream treatment. The primary driver here is risk reduction and compliance, with a net positive environmental impact when considering the full lifecycle. For this sketch, we focus on the direct operational energy trade-off:
- Net change in operational energy: (0.15 kWh/m³ - 0.065 kWh/m³) = +0.085 kWh/m³ (increase in direct electricity).
- Annual Operation: Assuming 330 days/year (for maintenance).
- Annual water volume: 1,000 m³/day * 330 days/year = 330,000 m³/year.
- Annual net energy change: 330,000 m³/year * 0.085 kWh/m³ = +28,050 kWh/year.
Carbon Footprint Impact: Using a plausible grid carbon intensity factor for industrial electricity in the EU/UK of 0.25 kg CO₂e/kWh (this is an illustrative figure, actual grid factors vary and are decreasing): Annual CO₂e impact = 28,050 kWh/year * 0.25 kg CO₂e/kWh = 7,012.5 kg CO₂e/year = 7.01 tonnes CO₂e/year increase in direct electricity emissions.
Crucially, this increase in direct electricity emissions is offset by the elimination of significant indirect emissions from chlorine production, transport, and the energy/resource demands of DBP-focused post-treatment. The primary gain is the reduction of DBP risk, improved compliance, and a cleaner discharge, which are often non-quantifiable in simple kWh terms but are paramount for ESG performance.
Traditional vs engineering evaluation path
| Topic | Chlorine + DBP management | UV / ozone barrier (engineering evaluation path) |
|---|---|---|
| Chemistry | Tanker chlorine, hypochlorite, and DBP sampling burden. | Dose verified as kWh/m³ + UV dose / ozone residual strategy. |
| Safety | Mains hazmat and secondary containment. | Electrical interlocks; no bulk oxidant storage in many layouts. |
| ESG | Hard to defend “chemical intensity” to buyers. | Clear story: fewer trucked reagents, documented dose records. |
Water Stewardship and Disclosure
Implementing chemical-free disinfection solutions provides tangible data points crucial for robust water stewardship reporting and ESG disclosure. By accurately metering the electricity consumption of UV/Ozone systems and documenting water flow rates, organisations can track their operational energy intensity per cubic meter of water treated. This data, combined with documented reductions in chemical usage and the elimination of DBP formation, forms a powerful evidence base.
Carbon savings calculator (illustrative)
Estimate annual electricity savings and avoided CO₂e when specific energy improves (e.g. after ERD, VFD tuning, or train optimization). Replace defaults with your meter data and your grid emission factor from your utility or ESG methodology.
ΔkWh/year ≈ Q(m³/h) × hours/year × (kWh/m³before − kWh/m³after) · tCO₂e ≈ ΔkWh × factor / 1000
Δ specific energy: 1.00 kWh/m³
Estimated electricity savings: 800,000 kWh/year
Indicative avoided emissions: 336 tCO₂e/year
Related equipment & product lines
These categories typically support the approach above—open any line to compare brands and models.
- UV DisinfectionUV systems and modules for pathogen inactivation and final disinfection barriers.View category →
- Ozone GeneratorOzone generation systems and peripherals for advanced oxidation processes.View category →
- Instrumentation & SensorsOnline measurement and control: flow, level, pressure, and water-quality sensors indexed from the Lenntech instrumentation hub.View category →
For a closer review, use the engineering inquiry form to share feed, capacity, target, and project stage. Submission does not constitute a completed design or performance commitment.