Solutions · Sustainability & ESG
Sustainable Supply Chain Auditing: green transparency for critical components
Scope 3 thinking for membranes, chemicals, and skids—evidence buyers can compare across tenders.
Use this guide within its scope
This page supports technical research and option comparison and is marked 2026. Illustrative values are not a quotation, completed process design, certification conclusion, or performance guarantee. Check current regulations, feed data, tests, and OEM records.
Problem
OEMs face questionnaires they cannot answer with PDFs alone.
Technology
engineering evaluation evidence templates: energy, chemistry, and transport intensity where available.
Results
Comparable scores across suppliers for procurement committees.
Engineering decision card
Use when
OEMs face questionnaires they cannot answer with PDFs alone.
Evaluate first
engineering evaluation evidence templates: energy, chemistry, and transport intensity where available.
Inputs still required
Feed source and variability, capacity, target quality, operating hours, discharge or reuse boundary, available space, and utilities.
Comparison output
Comparable scores across suppliers for procurement committees. The final decision still needs feed data, mass balance, and any necessary testing.
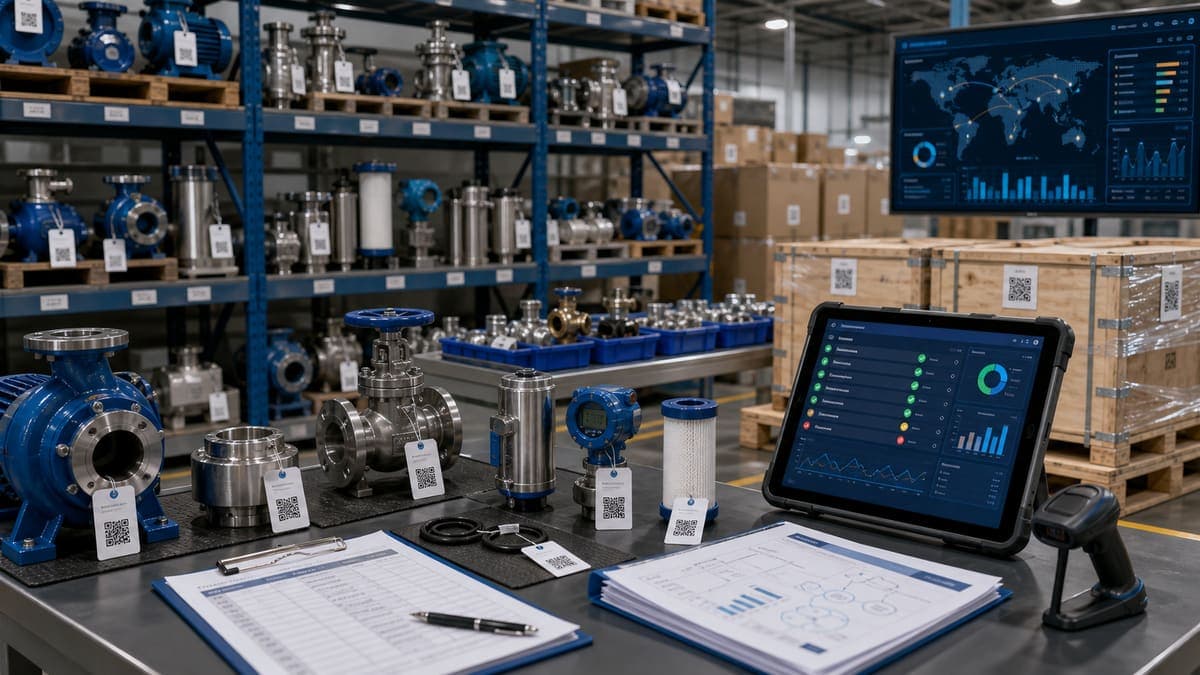
Sustainable Supply Chain Auditing: green transparency for critical components
In an increasingly interconnected global economy, the provenance of critical components has moved beyond mere quality and cost. For industrial buyers, Engineering, Procurement, and Construction (EPC) firms, and sustainability officers operating within or supplying to the UK and EU markets, rigorous sustainable supply chain auditing is no longer optional—it's a strategic imperative. The confluence of escalating carbon reduction targets, intensifying water stress risks, and tightening export-market ESG (Environmental, Social, and Governance) regulations (such as the EU's Corporate Sustainability Due Diligence Directive (CSDDD) and evolving UK requirements) demands an unprecedented level of transparency.
Worked energy / carbon sketch
To illustrate the tangible impact of informed component sourcing, consider the energy savings achievable through a supply chain audit that prioritises specific energy consumption in critical components.
Scenario: A water treatment plant with an existing Reverse Osmosis (RO) system is evaluating a replacement for its high-pressure pump or membrane modules. Through this approach's auditing process, an alternative supplier is identified whose components, validated by third-party data and operational metrics, offer a demonstrably lower specific energy consumption for permeate production.
Assumptions (Illustrative):
- Specific Energy Reduction (ΔkWh/m³): The new component reduces the energy required for permeate production by 0.5 kWh/m³ compared to the previous generation.
- System Flow Rate (Q): The RO system operates at a design capacity of 500 m³/hour.
- Annual Operating Hours (H): The plant runs for 8,000 hours per year (approximately 333 full days).
- Grid Emission Factor: The local electricity grid has an average emission factor of 0.2 kg CO₂e/kWh (plausible for many industrial regions, e.g., UK average 2023 grid electricity factor (non-degraded) is approx. 0.19 kg CO₂e/kWh).
Calculation:
-
Annual Energy Savings: Q × H × ΔkWh/m³ = 500 m³/hour × 8,000 hours/year × 0.5 kWh/m³ = 2,000,000 kWh/year.
-
Annual Carbon Emissions Reduction: 2,000,000 kWh/year × 0.2 kg CO₂e/kWh = 400,000 kg CO₂e/year = 400 tonnes CO₂e/year.
This illustrative calculation demonstrates how transparent, data-driven insights from sustainable supply chain auditing can lead to significant reductions in operational carbon footprint, directly impacting a company's Scope 2 and Scope 3 emissions. The ability to substantiate such claims with auditable data is crucial for robust ESG reporting and compliance.
Traditional vs engineering evaluation path
| Topic | Checkbox supplier audit | Component-level ESG evidence (engineering evaluation path) |
|---|---|---|
| Data | PDF attestations; no kWh per unit. | Metered mfg intensity, water, waste kg where available. |
| Cadence | Annual visit; stale by Q2. | Continuous feeds + spot verification. |
| Outcome | Hard to compare tenders fairly. | Normalised fields procurement can score. |
FAQ
Q1: Why is sustainable supply chain auditing critical now for industrial companies? A: With escalating global regulations (e.g., EU CSDDD, CBAM), increased investor scrutiny, and consumer demand for transparency, robust sustainable supply chain auditing is essential for compliance, market access, risk mitigation, and maintaining a competitive edge in export-oriented markets.
Q3: How does robust supply chain sustainability impact my company's export potential to the EU/UK? A: A verified sustainable supply chain demonstrates compliance with stringent UK and EU ESG regulations, reduces exposure to carbon border taxes, and positions your products favorably with buyers who prioritise environmental performance. It transforms regulatory hurdles into a clear market advantage.
Carbon savings calculator (illustrative)
Estimate annual electricity savings and avoided CO₂e when specific energy improves (e.g. after ERD, VFD tuning, or train optimization). Replace defaults with your meter data and your grid emission factor from your utility or ESG methodology.
ΔkWh/year ≈ Q(m³/h) × hours/year × (kWh/m³before − kWh/m³after) · tCO₂e ≈ ΔkWh × factor / 1000
Δ specific energy: 1.00 kWh/m³
Estimated electricity savings: 800,000 kWh/year
Indicative avoided emissions: 336 tCO₂e/year
Related equipment & product lines
These categories typically support the approach above—open any line to compare brands and models.
- RO MembranesReverse osmosis membrane elements for municipal and industrial desalination.View category →
- ChemicalsAntiscalants, cleaners, and process chemicals for water treatment operations.View category →
- Activated CarbonPowdered and granular activated carbon (PAC/GAC) for adsorption of organics, odor, and trace contaminants.View category →
For a closer review, use the engineering inquiry form to share feed, capacity, target, and project stage. Submission does not constitute a completed design or performance commitment.